Read the dashboard
For: Everyone
Whole guide as PDF (1 MB)Dashboard is the first screen after you sign in. You only see the outlets you are allowed to see.
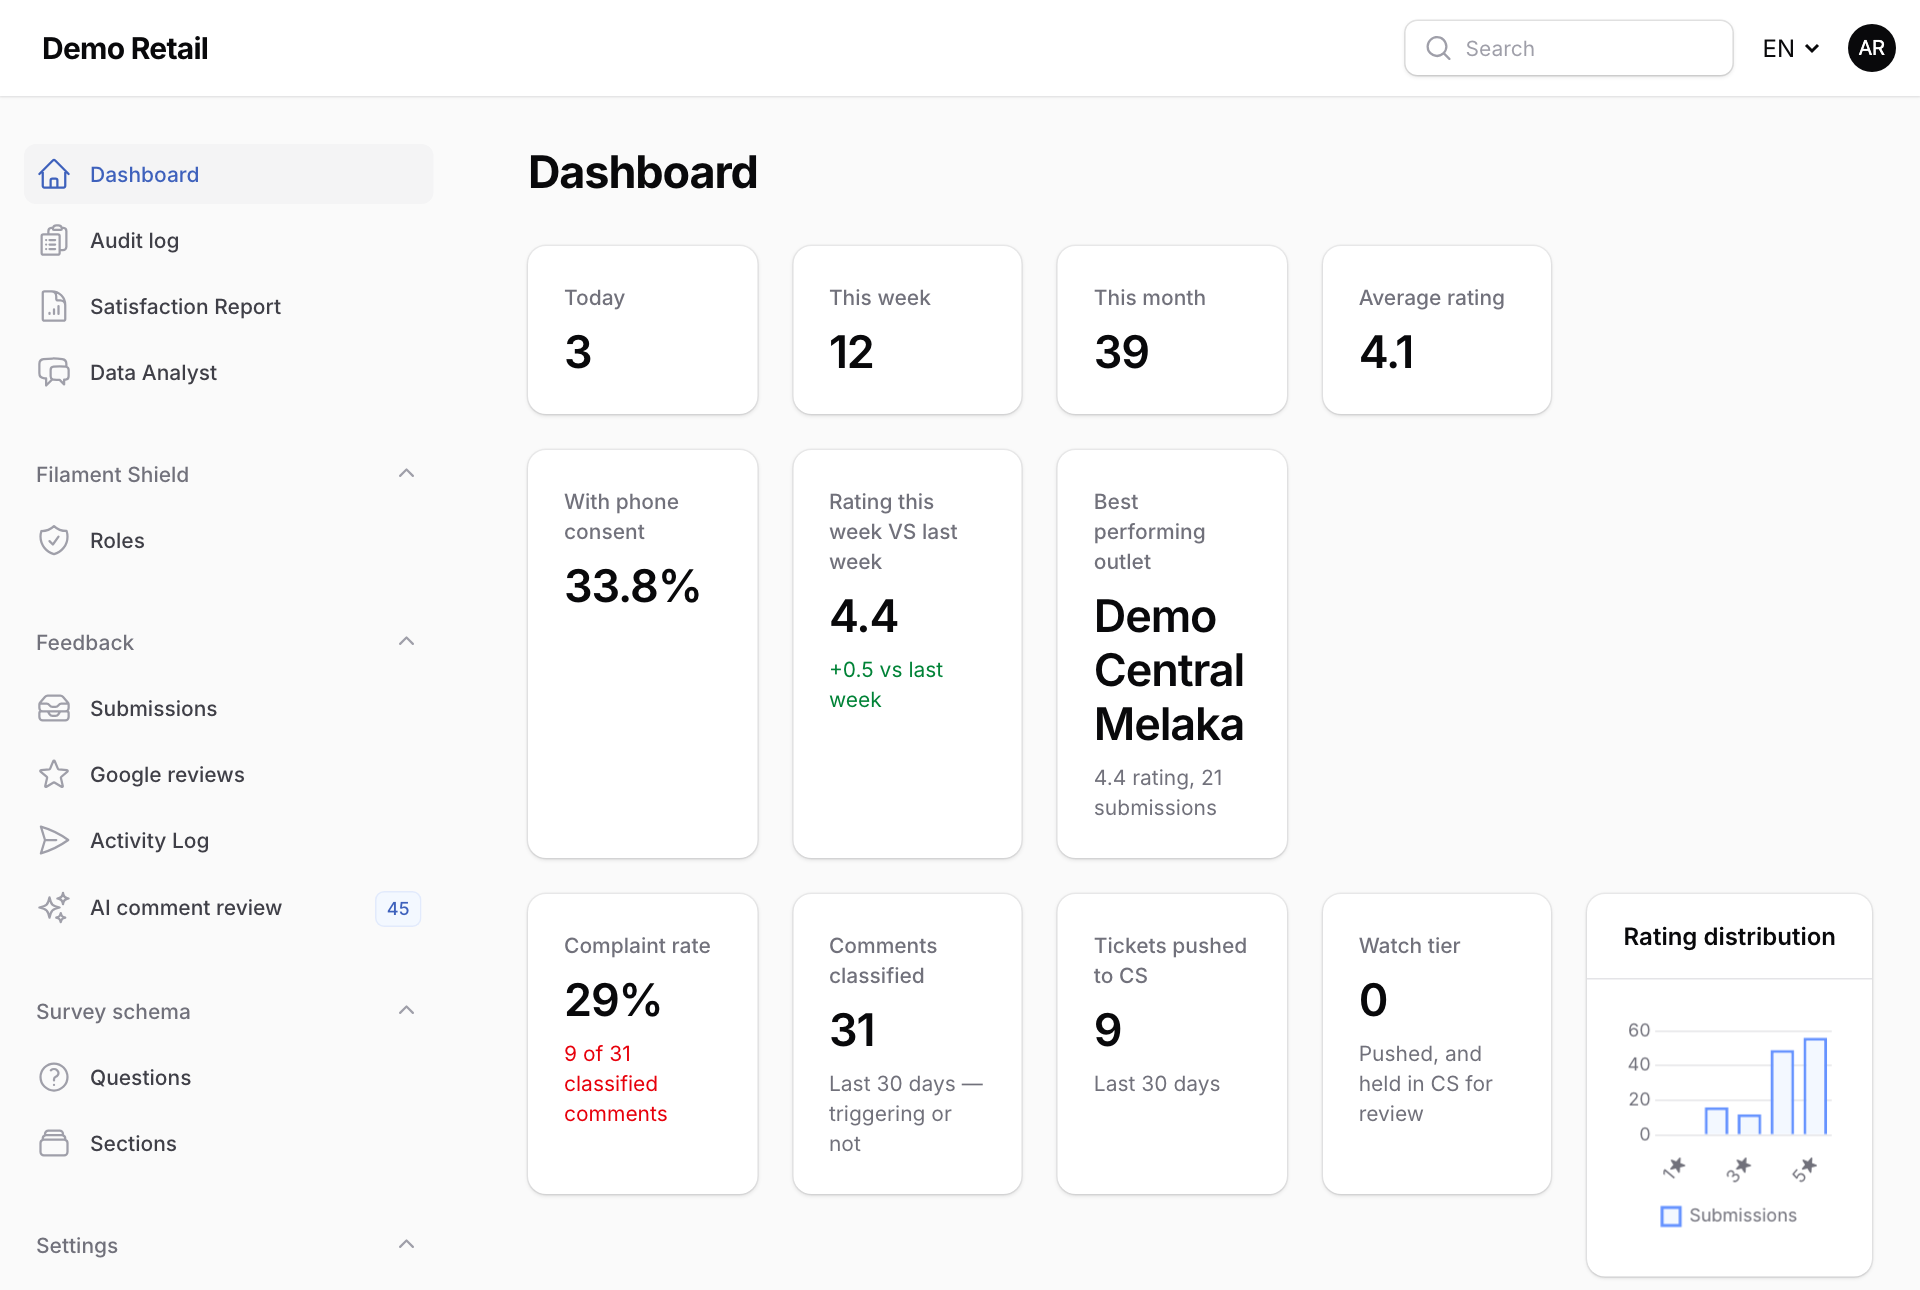
- Today, This week, This month: how many surveys came in.
- Average rating and Rating this week VS last week: whether customers are getting happier or less happy.
- Best performing outlet: the outlet with the highest average rating.
- Complaint rate: of the comments read in the last 30 days, how many were complaints.
- Tickets pushed to CS: how many unhappy customers were sent to Customer service in the last 30 days.
- Watch tier: tickets that were sent, but that Customer service holds for checking first, for example because the same phone number sent many surveys.
Scroll down for charts: the trend over 30 days, the spread of star ratings, the score for each of the five questions, and the best and worst outlets.
Use EN at the top right to switch the screens between English, Malay and Chinese.